Visualization
Input mapping
Even though it is not relevant for the input user usage, taking into account the input mapped entities over the background network is relevant for the diffusion process assessment, since the coverage of the input implies the actual entities-scores that are being diffused. In other words, only the entities whose labels match an entity in the network will be further processed for diffusion.
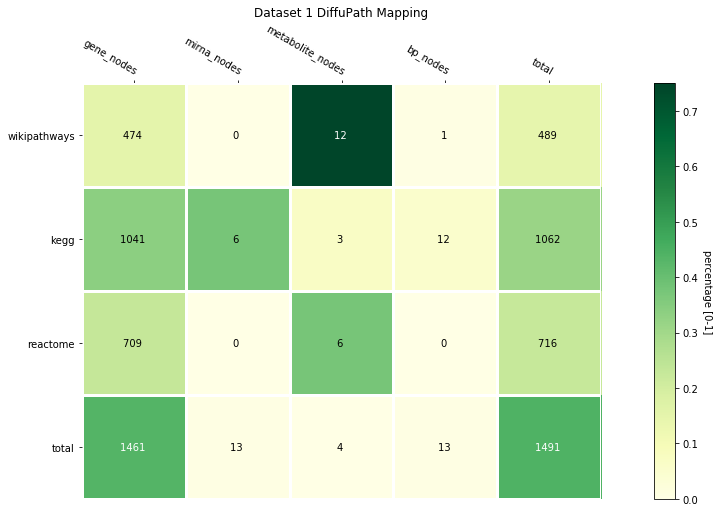
To visualize the mapping statistics heatmap, use the following function:
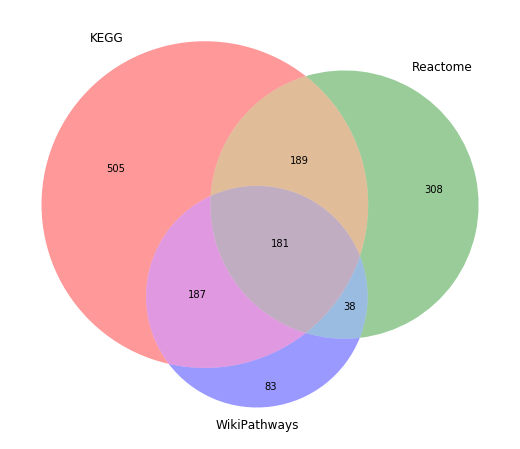
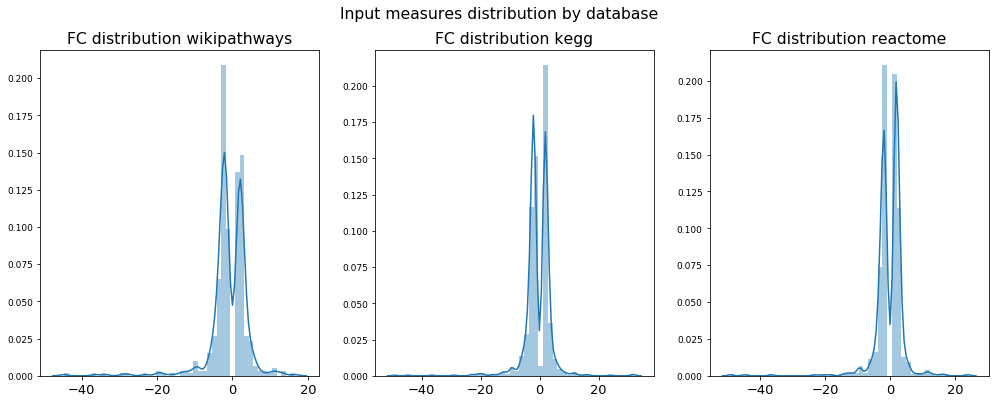
Further data views can be rendered for the input data mapping, such as VennDiagram to explore the overlap or distribution bloxplot:
Validations
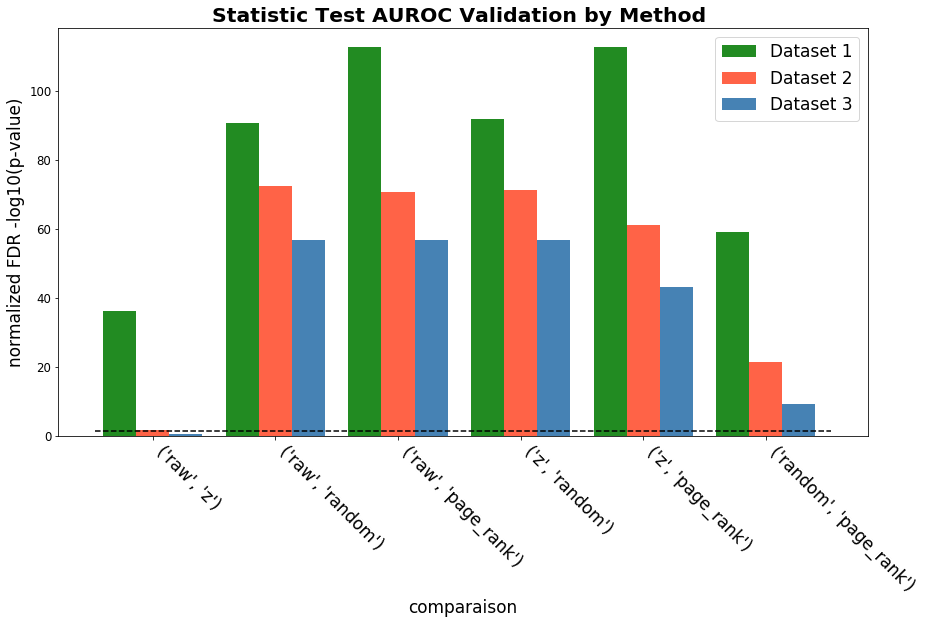
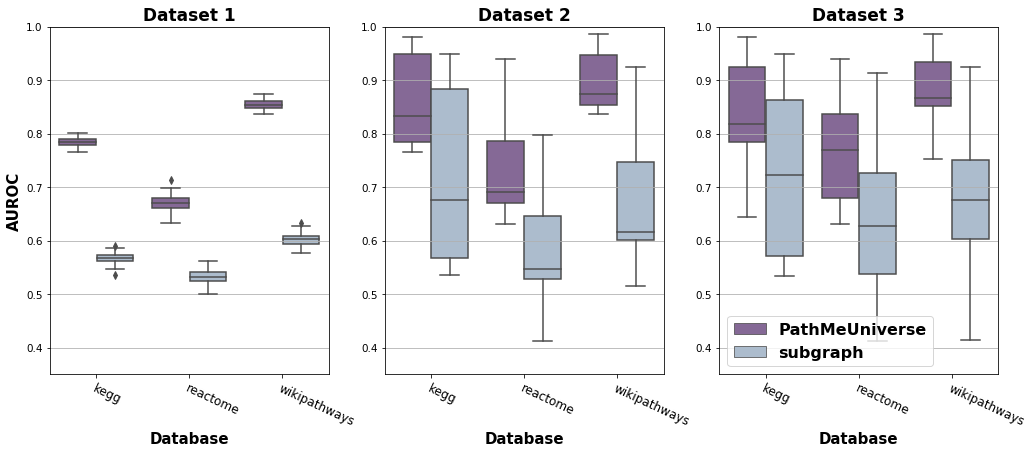
To visualize the metrics derived from validation experiments, you can plot metric Boxplots for repeated holdouts or iterated cross validation and its statistical tests and Barcharts with its threshold line:
Two dimensional BLOXPLOT:
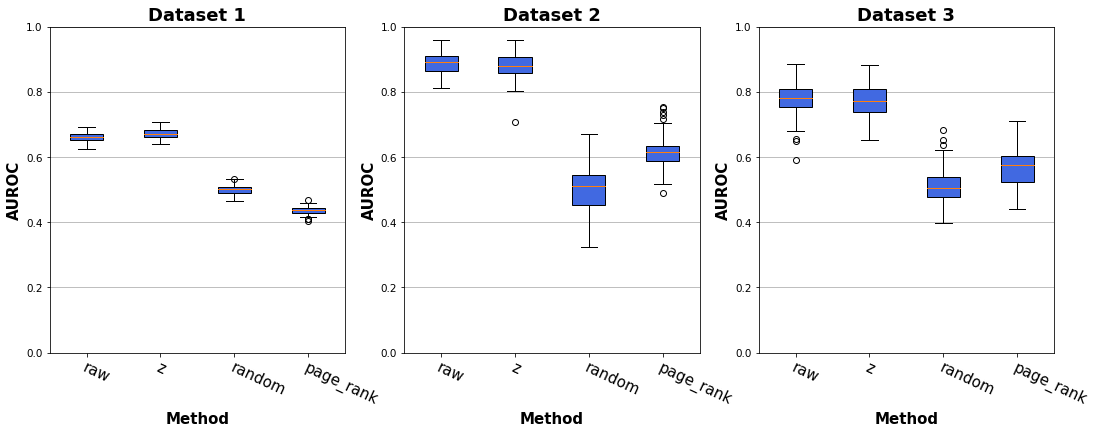
Three dimensional BLOXPLOT:
Statistical test BARCHART: